

LEQtion is a desktop sound level meter and dual-channel analyser: RTA, spectrograph, bargraph, time-weighted SPL, as many user-defined LEQs as you want, level history, CSV logging, a signal generator, and transfer function measurement with phase and coherence — on a grid of tiles you lay out yourself.
Before you rely on this: the DSP is verified numerically and pinned as tests — the A and C weighting curves reproduce the IEC 61672-1 table to better than 0.06 dB at the midband frequencies, a full-scale sine reads 0 dBFS through the band integrator, and LEQ is checked against signals whose answer is known in advance. The audio path has been run against real Core Audio hardware on macOS.
But it has not been checked against a reference sound level meter, no hardware calibrator has ever been connected to it, and the ASIO path compiles but has never carried audio. LEQtion is not a certified sound level meter and makes no conformance claim. Status: alpha.
This codebase was created with AI assistance, directed and reviewed by a human author.
Start here: measure the meter, not the room
Before you connect anything, open the Signal generator backend. It feeds the analyser directly — no interface, no microphone, no microphone permission — and it is how you check that the meter itself is behaving.
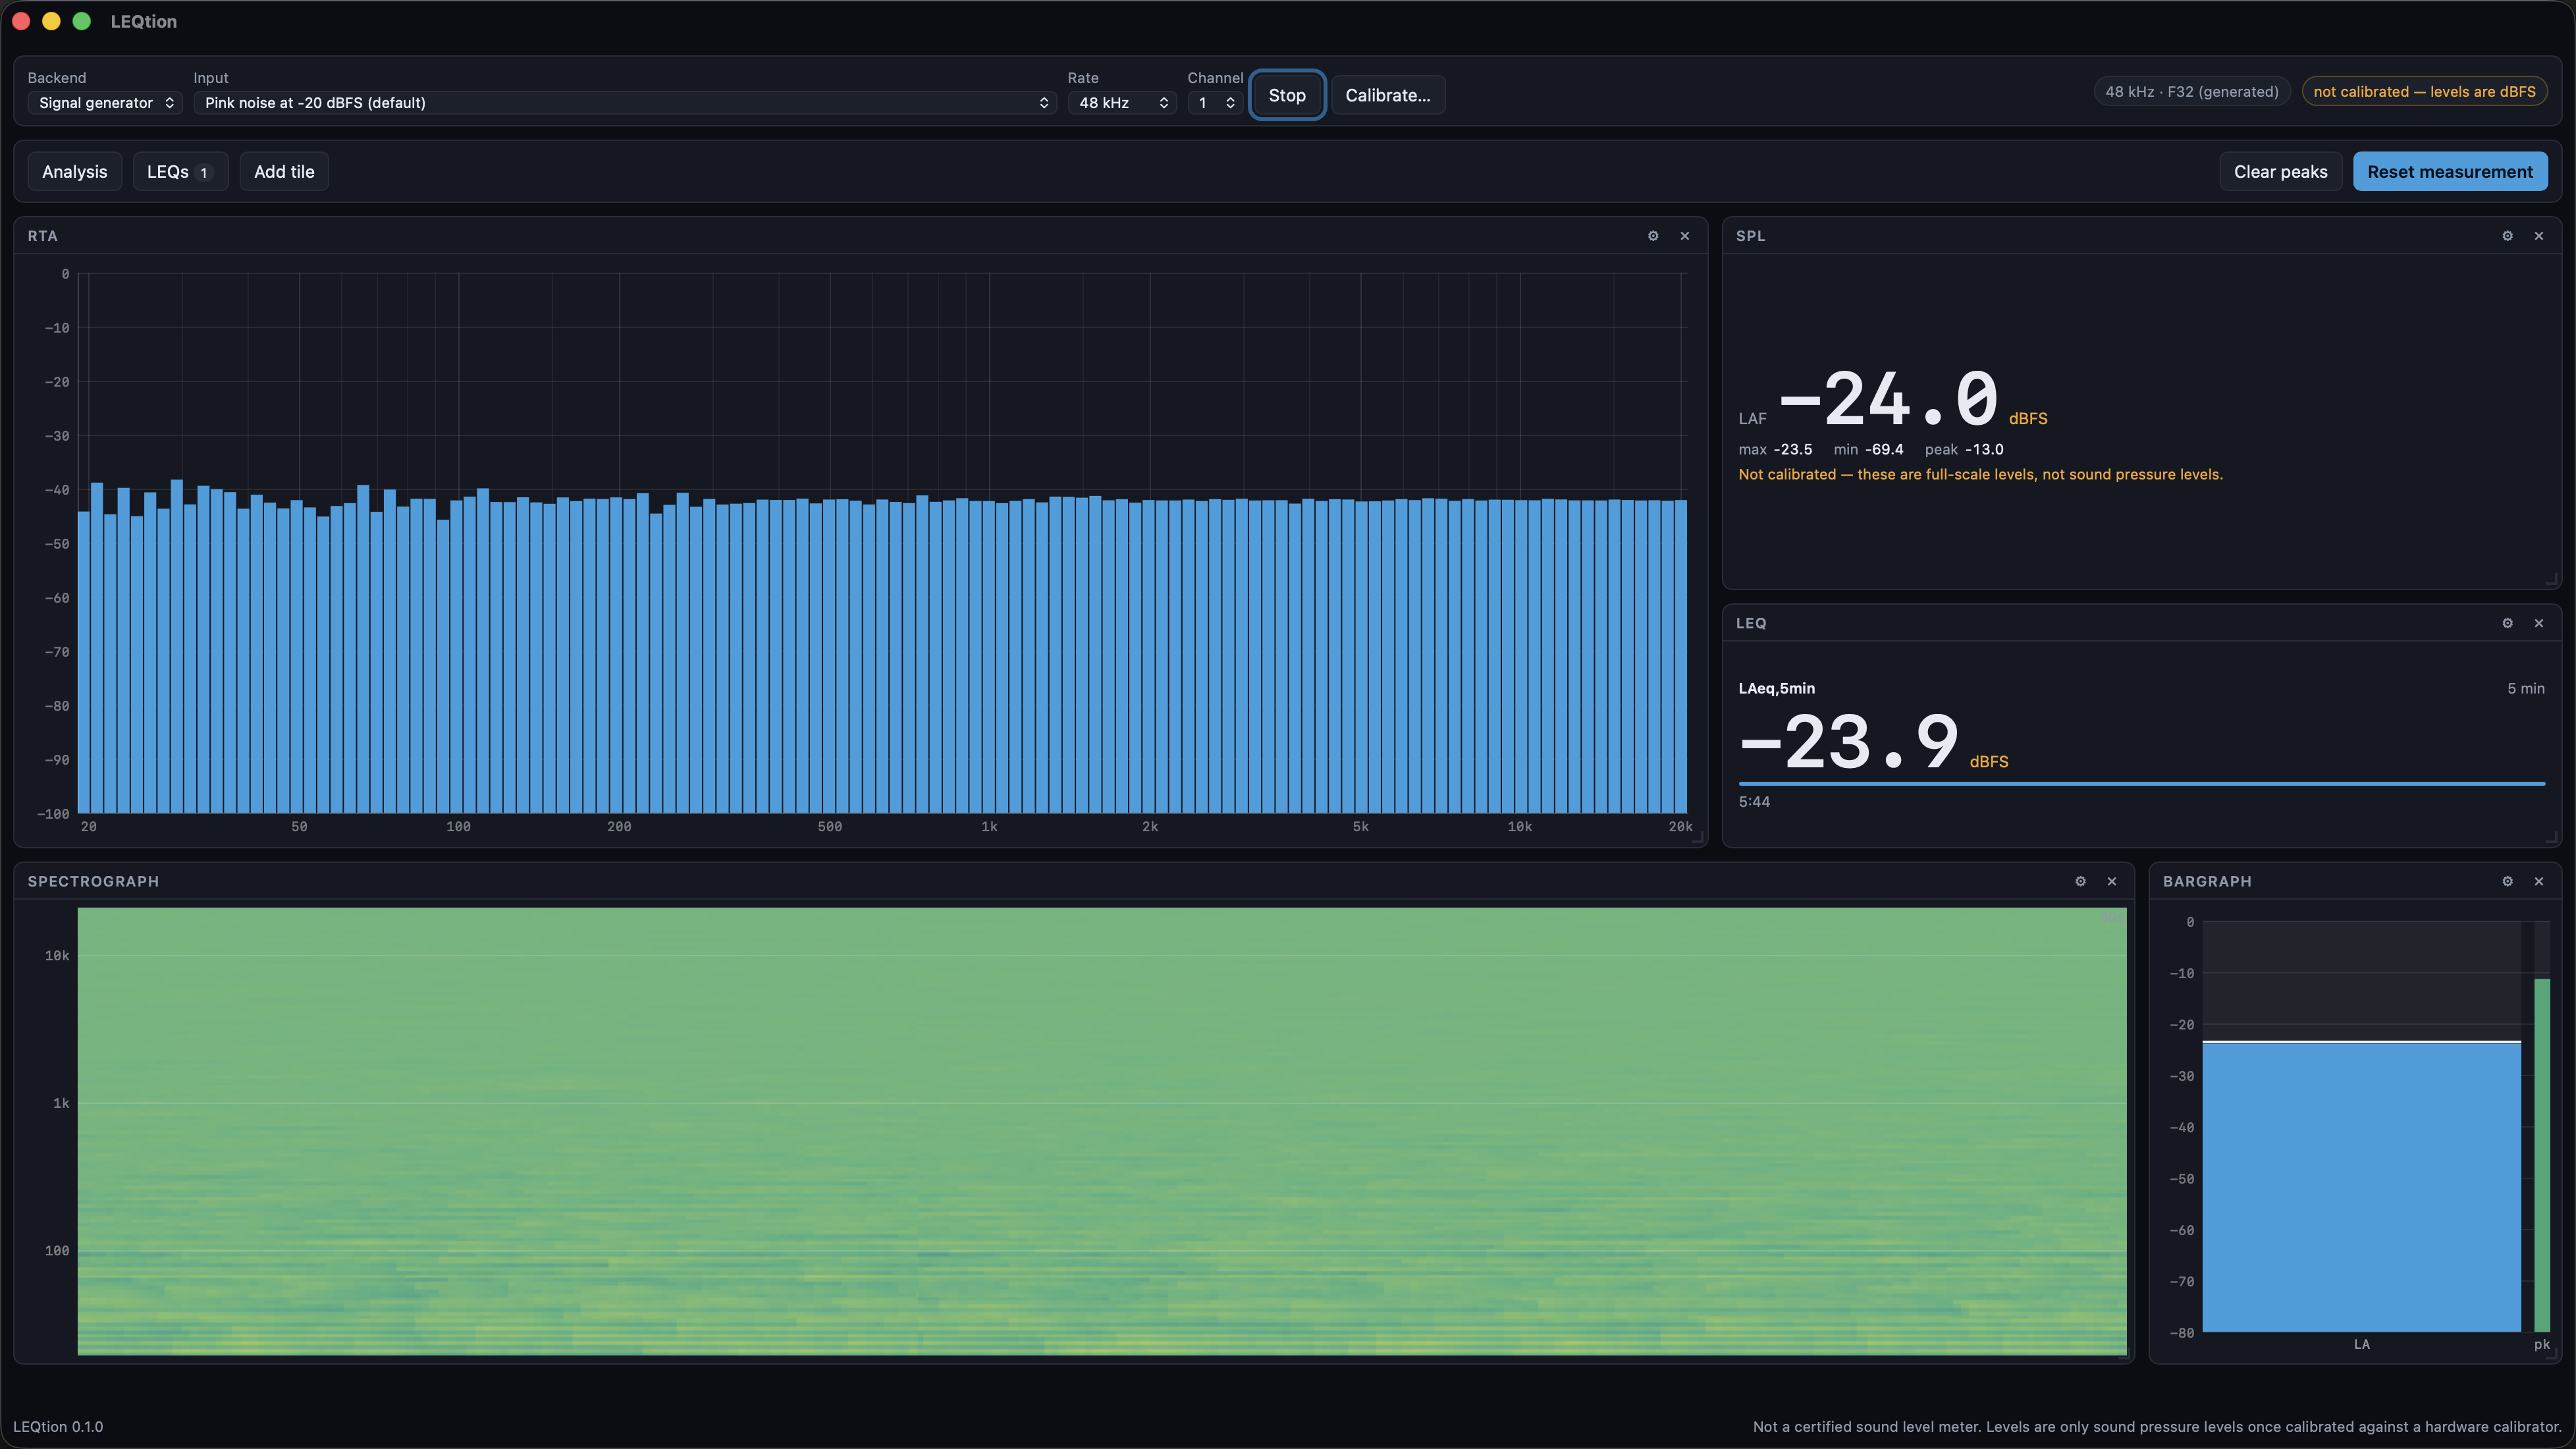
Pink noise at −20 dBFS through the generator backend, with no hardware in the chain. Pink noise is flat per octave, so a fractional-octave RTA reading flat across the band is the check — a wrong window, a wrong normalisation or a wrong band integration would show as a tilt or a step instead. Here LAF and LAeq,5min agree within 0.1 dB over a complete window, and every level says dBFS because nothing is calibrated.
Calibration is refused while the generator backend is open. There is no capsule in the chain, and an offset taken from a synthetic sine would be a number invented out of nothing.
The tiles
Add, remove, drag and resize them; the layout persists.
| Tile | What it shows |
|---|---|
| RTA | Fractional-octave spectrum, 1/1 down to 1/48, with selectable transform size, window, overlap, averaging and peak hold |
| Spectrograph | The same bands over time, scrolling, on the same log axis as the RTA so the two line up when stacked |
| Bargraph | Level meter with a held maximum, plus a separate input-peak strip that stays in dBFS because headroom is an electrical question |
| SPL | Time-weighted level — Fast, Slow and Impulse — with max, min and peak |
| LEQ | As many as you like, each with its own window and weighting |
| Level history | Any of those levels over time, as a line |
| Transfer function | Magnitude, phase and coherence against a reference |
LEQs run in the engine, not in the tile. An LEQ keeps integrating whether or not a tile is showing it, so you can close one and come back to it.
Each LEQ takes any window length you type — or a preset from 1 second to an hour, or “since reset” — and its own weighting (A, C or Z).
Level history and logging
Each point on a history chart covers a whole interval, and the band around the line is the min and max inside that interval — so a transient between ticks is on the chart rather than missed. Zooming out buckets the points in the engine and keeps the extremes, so the trace never flattens as you look further back.
Data logging writes the measurement to CSV, one row per interval, every series at once. The rows are the chart’s own points rather than a second sampling on a different clock.
Every row states whether it is calibrated and how many frames have been dropped. A log that covers a gap in the audio says so in the file.
Calibration
Against a hardware acoustic calibrator, 94 or 114 dB at 1 kHz.
Until you calibrate, every level is a full-scale level and the app says so — on the SPL tile, on the LEQ tile and in the device bar. An uncalibrated number presented as a sound pressure level is the single most damaging thing a meter can do.
A calibration is trusted silently for the rest of a measurement, so a run has to satisfy four things before it can be accepted, and there is no override:
- A steady level — spread under 0.5 dB.
- The right frequency — the tone within 5% of what the calibrator claims.
- No clipping.
- A tone well clear of the noise floor.
Each refusal explains what to do about it. “Unstable” usually means the calibrator is not seated on the capsule.
What it cannot check: that the calibrator is itself in calibration, or that the preamp gain has not been changed afterwards. Changing gain by one click invalidates the offset completely and nothing in software can detect it — which is why the calibration records the device it was taken on.
The signal generator
Pink noise, white noise, sine and a repeating log sweep, out of a channel you choose, with optional band-limiting.
Level is dBFS RMS, and the expected peak is shown beside it — because pink noise at −6 dBFS RMS clips hard while reading like a conservative setting.
Transfer function
H = Sxy/Sxx — the H1 estimator, from complex-averaged cross-spectra, against a reference
that is either the generator’s own output tapped internally or a hardware loopback on an input.
Coherence is drawn, not hidden. Every point is faded in proportion to it, and the magnitude trace breaks wherever coherence falls below the floor.
A transfer function without coherence looks equally confident where the measurement is solid and where it is picking up the air conditioning — and people tune systems off the second kind.
Delay finding locates the arrival from the impulse response, sub-sample interpolated, and reports it in milliseconds, metres and samples with a confidence figure. The reference must be delay-compensated before any of the rest means anything.
Several transforms run in parallel, each serving a couple of octaves and halving in length as frequency rises, stitched onto one set of points. One FFT length cannot serve both 20 Hz and 16 kHz: at 48 kHz a 16384-point transform gives 2.9 Hz bins, about right at 30 Hz and absurdly narrow at 10 kHz.
Sample rate matters more than you’d expect
The analogue A-weighting design has two more poles than zeros, and every s→z transform has to do something with that surplus. Both textbook answers are badly wrong at the top of the band:
| Design | A-weighting error at 19 kHz, 48 kHz |
|---|---|
| Bilinear — forces a double zero onto Nyquist | −13.6 dB |
| Plain matched-Z — invents no surplus zero | +7.2 dB |
| What LEQtion does | under 1 dB |
Measured worst deviation over 20 Hz – 20 kHz:
| Sample rate | A | C |
|---|---|---|
| 44.1 kHz | 1.15 dB | 0.30 dB |
| 48 kHz | 0.99 dB | 0.21 dB |
| 96 kHz | 0.22 dB | 0.01 dB |
Run at 96 kHz if you care. It costs nothing but CPU and makes the weighting effectively exact — which is why the app shows the sample rate rather than hiding it.
In practice the cost is smaller than the headline: on a deliberately harsh 29-tone signal with as much energy at 16 kHz as at 1 kHz, the A-weighted level is 0.23 dB out at 48 kHz.
Dropped audio
If the analysis thread falls behind, the audio callback discards samples rather than blocking the driver. Time then goes missing, and every LEQ on screen is short by an unknown amount.
The device bar says so and tells you to restart the measurement. A meter that quietly stretches time is worse than one that admits a gap.
Backends
Core Audio, WASAPI, ALSA and JACK out of the box. ASIO is behind a build flag, compiles, and has never carried audio — see asio.md.
Command-line diagnostics
Two ship with it, for when a measurement looks wrong and the GUI is in the way.
Check that an input delivers audio at all:
cargo run -p leqtion-audio --example capture -- --list
cargo run -p leqtion-audio --example capture -- --seconds 3
A run that reports frames arriving at exactly digital silence is the signature of macOS denying microphone access.
The whole measurement chain without the window — same engine, same numbers:
cargo run --example meter -- --seconds 30 --offset 120Troubleshooting
| Symptom | Cause |
|---|---|
| Everything reads dBFS | Not calibrated. That is the design — it will not present a full-scale level as an SPL. |
| Calibration refused | One of the four checks failed, and the message says which. “Unstable” usually means the calibrator isn’t seated. |
| Calibration option greyed out | The signal generator backend is open. There is no capsule in the chain. |
| Levels arrive at exactly digital silence | macOS is denying microphone access. Check the capture example. |
| LEQ looks short | Frames were dropped; the device bar will say so. Restart the measurement. |
| A-weighted reading disagrees with a real meter at HF | Expected at 44.1/48 kHz — about 1.1 dB by 10 kHz. Run at 96 kHz. |
| Transfer function trace breaks up | Coherence below the floor. That is the feature, not a fault — the measurement is not trustworthy there. |
| Transfer function looks confident but wrong | Check the reference is delay-compensated. |
| Generator clips at a level that looked safe | Level is dBFS RMS. Read the expected peak shown beside it. |
| ASIO build does nothing | It has never carried audio. Use WASAPI on Windows. |
See also
- asio.md — the ASIO build flag and its state
- field-test.md — what a real-world check should cover
- README — the DSP rationale in full, and downloads